Signals from formulas — a heartbeat, drawn by arithmetic
Most columns in a config are drawn: a name from a pack, a number from a range, a date
from a window. A signal is different. Its value at any instant is not a choice — it follows
from where you are in time. That makes it a job for
<gen type="formula">, and it is the one construct that can
produce a shape rather than a bag of values.
This guide builds a synthetic electrocardiogram: a two-column CSV that draws a recognizable heartbeat when you plot it. The same method fits any repeating measurement — a vibration trace, a daily temperature curve, hourly traffic on a road.
A heartbeat is five bells
One heartbeat is five bumps in a row, and each bump is the same shape: a bell, tall in the middle and fading to nothing on both sides. Three numbers describe one bell — how tall it is, where its center sits, and how wide it spreads:
height * exp(-pow((position - center) / width, 2))
exp and pow are ordinary expression functions, and they
behave the same in all five implementations. Change center and the bump slides along the
time axis. Change width and it gets narrower or flatter. Nothing else is needed.
Time, and the beat it belongs to
Two columns turn a row counter into a clock. Sample 250 times a second, which is what a real monitor does, so each row is 4 milliseconds:
<sequence name="T"><gen type="formula" expr="(_count - 1) * 4"/></sequence>
<sequence name="N"><gen type="formula" expr="floor(T / 1000)"/></sequence>
_count is the row number, so T is the time in milliseconds. floor(T / 1000) is the
beat number: it stays at 0 for a whole second, then becomes 1, then 2.
That second column is the useful one. Anything computed from N holds still for the length
of a beat and changes only at the boundary, which is how one beat comes out different from
the next without the bumps inside it wobbling.
Where the beat starts
A beat does not have to begin on the whole second:
<sequence name="Onset"><gen type="formula" expr="N * 1000 + 45 * sin(N * 1.7)"/></sequence>
<sequence name="Phase"><gen type="formula" expr="T - Onset"/></sequence>
Onset is where beat N begins, pushed up to 45 milliseconds either side of the round
second. Phase is how far into its own beat the current row sits, and every bell is placed
against Phase rather than against the clock.
A heart speeds up as you breathe in and slows down as you breathe out, so the gap between beats keeps moving by a few percent. A recording without that variation reads as a drawing of a heartbeat rather than a measurement of one.
The five bells, with real numbers
<sequence name="P"><gen type="formula" expr="0.12 * exp(-pow((Phase - 200) / 22, 2))"/></sequence>
<sequence name="Q"><gen type="formula" expr="-0.16 * exp(-pow((Phase - 372) / 10, 2))"/></sequence>
<sequence name="R"><gen type="formula" expr="Amp * exp(-pow((Phase - 400) / 8, 2))"/></sequence>
<sequence name="S"><gen type="formula" expr="-0.28 * exp(-pow((Phase - 428) / 12, 2))"/></sequence>
<sequence name="TW"><gen type="formula" expr="0.35 * exp(-pow((Phase - 620) / 45, 2))"/></sequence>
| Bell | Height, mV | Center, ms | Width, ms | What it is |
|---|---|---|---|---|
| P | 0.12 | 200 | 22 | the upper chambers contracting |
| Q | −0.16 | 372 | 10 | a dip before the main spike |
| R | 1.20 | 400 | 8 | the ventricles firing |
| S | −0.28 | 428 | 12 | the dip after it |
| T | 0.35 | 620 | 45 | the ventricles recovering |
Two of the numbers carry the character of the trace. R is eight milliseconds wide against
a beat of a thousand, which is why the spike is nearly vertical. T is 45, which is why the
last bump is a long low hill.
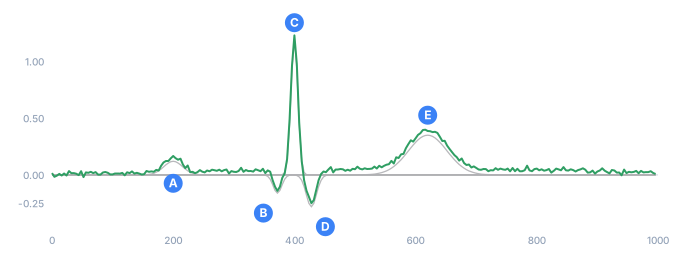
- the five bells, each one a column of its own
- their sum, the only column the file prints
- AP — the upper chambers contract
- BQ — the dip before the spike
- CR — the ventricles fire
- DS — the dip after
- ET — the ventricles recover
The horizontal axis is milliseconds within one beat; the vertical is millivolts. Five of
these columns are never printed. A sequence that no <block> mentions still takes part in
the arithmetic, which is what lets a config carry its working out.
Making it live
Two more columns keep every beat from being a copy of the last one:
<sequence name="Amp"><gen type="formula" expr="1.20 + 0.07 * sin(N * 2.3)"/></sequence>
<sequence name="Drift"><gen type="formula" expr="0.05 * sin(_count / 95)"/></sequence>
<sequence name="Noise"><gen type="number" distribution="normal" mean="0" sd="0.012" decimals="4"/></sequence>
Amp varies the height of the spike from beat to beat, because it reads N. Drift rocks
the baseline slowly, the way a chest rising and falling moves the electrodes. Noise is the
only drawn column on the page: normal, tiny, and different on every row, which is what a
real sensor adds.
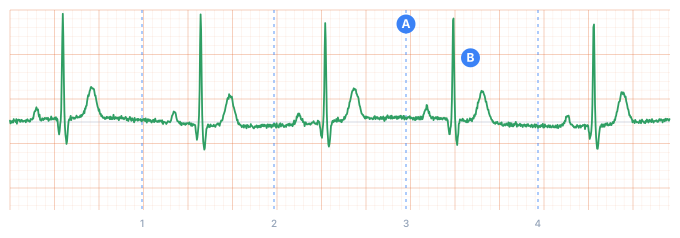
- whole seconds
- the generated trace
- Athe mark at the third second
- Bthe spike that misses it
Measured over ten seconds of this output, the gap between spikes runs from 932 to 1068 milliseconds — a pulse wandering between 56 and 64 beats per minute. That is the range a resting adult shows.
Nothing in the wander is random. sin(N * 1.7) is arithmetic on the beat number, so the
same seed gives the same file, byte for byte, on every implementation. Irregularity is a
thing you construct here, not a thing you give up control of.
The whole config
<tdc>
  <env count="2500" seed="ecg">
    <sequence name="T"><gen type="formula" expr="(_count - 1) * 4"/></sequence>
    <sequence name="N"><gen type="formula" expr="floor(T / 1000)"/></sequence>
    <sequence name="Onset"><gen type="formula" expr="N * 1000 + 45 * sin(N * 1.7)"/></sequence>
    <sequence name="Phase"><gen type="formula" expr="T - Onset"/></sequence>
    <sequence name="Amp"><gen type="formula" expr="1.20 + 0.07 * sin(N * 2.3)"/></sequence>

    <sequence name="P"><gen type="formula" expr="0.12 * exp(-pow((Phase - 200) / 22, 2))"/></sequence>
    <sequence name="Q"><gen type="formula" expr="-0.16 * exp(-pow((Phase - 372) / 10, 2))"/></sequence>
    <sequence name="R"><gen type="formula" expr="Amp * exp(-pow((Phase - 400) / 8, 2))"/></sequence>
    <sequence name="S"><gen type="formula" expr="-0.28 * exp(-pow((Phase - 428) / 12, 2))"/></sequence>
    <sequence name="TW"><gen type="formula" expr="0.35 * exp(-pow((Phase - 620) / 45, 2))"/></sequence>

    <sequence name="Drift"><gen type="formula" expr="0.05 * sin(_count / 95)"/></sequence>
    <sequence name="Noise"><gen type="number" distribution="normal" mean="0" sd="0.012" decimals="4"/></sequence>

    <sequence name="Sec"><gen type="formula" expr="T / 1000" decimals="3"/></sequence>
    <sequence name="MV"><gen type="formula" expr="P + Q + R + S + TW + Drift + Noise" decimals="4"/></sequence>

    <before><line><data>seconds,millivolts</data></line></before>
  </env>

  <block>
    <line><data>${{Sec}},${{MV}}</data></line>
  </block>
</tdc>
seconds,millivolts
0.000,0.0158
0.004,-0.0164
0.008,-0.0065
0.012,0.0089
0.016,-0.0052
0.020,0.0121
Ten seconds of recording is 2,500 rows. The opening rows are the flat stretch before the first beat, which is what a trace looks like between heartbeats. Load the file into a spreadsheet, plot column B against column A as a line, and the shape appears.
Turning the knobs
| To change | Edit | Effect |
|---|---|---|
| Heart rate | 1000 in Onset and N | 600 gives 100 beats per minute |
| Sampling rate | 4 in T | 2 gives 500 samples per second |
| Strength of the spike | 1.20 in Amp | the height of R in millivolts |
| Steadiness | 45 in Onset | 0 makes every beat exactly a second |
| Sensor quality | sd on Noise | larger is a noisier recording |
Setting the 45 to 0 is worth doing once. The trace stays correct and starts looking
manufactured, which shows how much of "realistic" lives in the irregularity rather than in
the shape.
Where else this fits
The method is not about hearts. Anything that repeats with a period, varies a little each
cycle, and carries noise takes the same three parts: floor to number the cycles, a phase
inside the cycle, and bells or sines placed against that phase. Machine vibration, a daily
temperature curve, and hourly traffic counts are all built this way.
For a column that instead accumulates across rows, see
running. For one figure computed over the whole run, see
stat.