Missing data — missing
Use it when you need to test how your code copes with holes. Real data is
almost never complete: a phone number was never entered, an income went missing, a
field is just blank. If you only ever test on "perfect" rows, the first null in
production breaks everything. The missing attribute mixes blanks in on purpose
so you can see the failure before your users do.
missing is a cross-cutting attribute — it works on any
<gen>, whatever it generates.
Example outputs below are illustrative: the exact rows a given seed produces
can shift between core versions, but the behavior the attribute guarantees does
not.
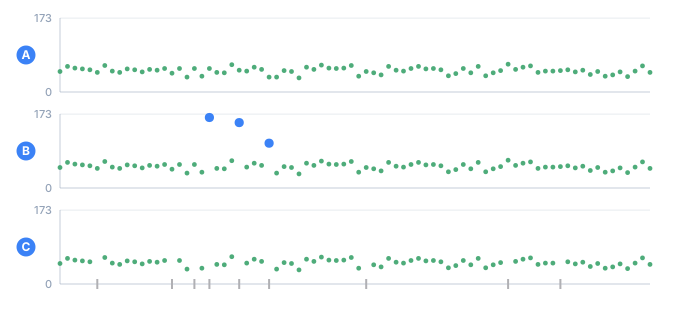
- Athe clean series
- Bwith anomaly= — the marked points are the injected outliers
- Cwith missing= — the marks on the floor are rows that produced no value
How to turn it on
Put missing="p" on a <gen>, where p is a fraction from 0 to 1 — the
share of values that become empty:
<gen type="number" value="30000..90000" missing="0.3"/>
Roughly 30% of the incomes come out empty; the rest are ordinary numbers.
Each value is dropped independently with that probability. In statistics this is called MCAR — Missing Completely At Random — the blanks fall without regard to any other field or to the value itself.
By default a missing value is an empty string. Want your own marker (NULL,
NA, —)? Set missing_as — see below.
Before and after — what a blank actually changes
The problem. Until you see the same field "whole" and "holey" side by side, it's hard to tell what's happening: which value was lost, and which was never there.
The tool. Take one list of cities and make two columns from it: Full as-is,
and Holey — the same list with missing.
order="sequential" walks the list strictly in order, so
both columns line up row for row and you see exactly what dropped out:
<env count="8" seed="rec">
  <sequence name="Full"> <gen type="text" value="Austin,Denver,Boston,Seattle,Chicago,Dallas,Portland,Miami" order="sequential"/></sequence>
  <sequence name="Holey"><gen type="text" value="Austin,Denver,Boston,Seattle,Chicago,Dallas,Portland,Miami" order="sequential" missing="0.4"/></sequence>
</env>
...
<data>full=${{Full}} | holey=${{Holey}}</data>
full=Austin | holey=Austin
full=Denver | holey=
full=Boston | holey=
full=Seattle | holey=
full=Chicago | holey=Chicago
full=Dallas | holey=Dallas
full=Portland | holey=Portland
full=Miami | holey=Miami
Everything is in place on the left; on the right, the same rows — but Denver,
Boston, and Seattle have vanished. The value wasn't swapped for another one, and
nothing shifted up to fill the gap: the cell became empty. (On 8 rows at
missing="0.4" three dropped — the share is random, and on a small sample the spread
is wide.)
A visible marker — missing_as
The problem. An empty string is invisible in an export: in a CSV it's just
"nothing between two commas," and you can't tell a blank from a short value by
looking. Real datasets usually flag a hole explicitly — NULL, NA, —.
The tool. missing_as="marker" prints your text where the blank would be.
The rows that go missing are the same ones (they're chosen by the seed and
the column name, not by the marker); only what fills the hole changes:
mask= and case= run after the hole is filled, so they reshape the marker too:
missing_as="n/a" case="upper" writes N/A. Write the marker as you want it to appear,
and if a mask would mangle it, put the formatting on a separate sequence.
<sequence name="Holey">
  <gen type="text" value="Austin,Denver,Boston,Seattle,Chicago,Dallas,Portland,Miami"
       order="sequential" missing="0.4" missing_as="NULL"/>
</sequence>
full=Austin | holey=Austin
full=Denver | holey=NULL
full=Boston | holey=NULL
full=Seattle | holey=NULL
full=Chicago | holey=Chicago
full=Dallas | holey=Dallas
full=Portland | holey=Portland
full=Miami | holey=Miami
The holes are on the same rows — 2, 3 and 4 — as before, where Denver, Boston and
Seattle were: adding the marker moved nothing. Set missing_as="—" or
missing_as="NA" and you get your own marker in the same places.
How many holes — varying the rate
The problem. You want to know how the system behaves under "rare" blanks and under "frequent" ones. A single rate won't show you that.
The tool. Change only missing, keep everything else the same. X is a value
in place, [] is a hole. Three columns, 20 rows:
<env count="20" seed="demo">
  <sequence name="A"><gen type="text" value="X" order="sequential" missing="0.1"/></sequence>
  <sequence name="B"><gen type="text" value="X" order="sequential" missing="0.3"/></sequence>
  <sequence name="C"><gen type="text" value="X" order="sequential" missing="0.6"/></sequence>
</env>
...
<data>0.1:[${{A}}]  0.3:[${{B}}]  0.6:[${{C}}]</data>
0.1:[X]  0.3:[X]  0.6:[]
0.1:[X]  0.3:[]  0.6:[X]
0.1:[X]  0.3:[X]  0.6:[X]
0.1:[X]  0.3:[]  0.6:[X]
0.1:[X]  0.3:[]  0.6:[]
0.1:[X]  0.3:[]  0.6:[X]
0.1:[X]  0.3:[X]  0.6:[]
0.1:[]  0.3:[X]  0.6:[]
0.1:[X]  0.3:[X]  0.6:[]
0.1:[X]  0.3:[X]  0.6:[X]
0.1:[]  0.3:[X]  0.6:[X]
0.1:[X]  0.3:[X]  0.6:[X]
0.1:[X]  0.3:[X]  0.6:[]
0.1:[X]  0.3:[X]  0.6:[]
0.1:[X]  0.3:[]  0.6:[]
0.1:[X]  0.3:[X]  0.6:[]
0.1:[X]  0.3:[X]  0.6:[X]
0.1:[X]  0.3:[X]  0.6:[X]
0.1:[X]  0.3:[X]  0.6:[]
0.1:[X]  0.3:[X]  0.6:[X]
Count the empty [] down each column: 0.1 → 2 holes out of 20, 0.3 → 5,
0.6 → 10. Raise the rate and the holes multiply. The rate × 20 would be
2 / 6 / 12, and only the first column landed on it: each value is dropped
independently, so over 20 rows the count varies around the expected number
rather than hitting it. Over 20,000 rows it lands much closer.
Missing across several fields
missing combines with anything — a plain range, a
template, a regex
pattern, a statistical distribution. Here's a record built from three fields: a
name (no blanks), a phone (missing="0.3", marker N/A), and an income
(missing="0.25", with the default empty marker):
<env count="8" seed="demo">
  <sequence name="Name">   <gen type="template" value="person.male.firstName"/></sequence>
  <sequence name="Phone">  <gen type="regex" value="\+1 \(555\) [0-9]{3}-[0-9]{4}" missing="0.3" missing_as="N/A"/></sequence>
  <sequence name="Income"> <gen type="number" value="30000..90000" missing="0.25"/></sequence>
</env>
...
<data>${{Name}} | phone: ${{Phone}} | income: ${{Income}}</data>
Richard | phone: +1 (555) 226-8995 | income: 38370
David | phone: +1 (555) 067-4473 | income: 70315
Joseph | phone: N/A | income: 41008
William | phone: N/A | income: 85063
John | phone: +1 (555) 528-7933 | income:
Michael | phone: +1 (555) 140-4007 | income: 48334
James | phone: N/A | income: 46153
Robert | phone: N/A | income: 33986
Some rows have N/A for the phone; row 5 has an empty income (the default marker
is nothing at all). The blanks in the two fields are independent: a hole in
one column tells you nothing about the other.
Which rows may go missing — missing_when
missing="p" on its own drops values without regard to anything else. That is one
of the three ways real data goes missing, and the least interesting: the holes
carry no information, so nothing can be learnt from them and nothing can be
predicted about them.
missing_when="…" adds the other two. It is a condition, written in the same
expression language as if=, and it decides
which rows are eligible at all. missing="p" still decides how often an
eligible row actually goes blank.
| What you write | What it is called | Where the hole comes from |
|---|---|---|
missing="0.2" | MCAR | nothing — every row is equally likely |
missing="0.8" missing_when="Age < 30" | MAR | another column you can still see |
missing="0.8" missing_when="_value > 60000" | MNAR | the value itself, which is now gone |
The names matter because they decide what a model trained on the file can be scored on. MCAR holes teach nothing. MAR holes are predictable from what is still in the row — an imputation step has something to work with. MNAR holes are predictable only from what was taken away, which is the hard case, and the one your pipeline is most likely to get wrong.
MAR — the hole depends on another column
<sequence name="Age"><gen type="number" value="18..70"/></sequence>
<sequence name="Income">
    <gen type="number" value="30000..90000" missing="0.8" missing_as="NULL" missing_when="Age < 30"/>
</sequence>
age: 66 | income: 33520
age: 56 | income: 76606
age: 28 | income: NULL
age: 26 | income: NULL
age: 67 | income: 40610
age: 33 | income: 86092
age: 68 | income: 86789
age: 18 | income: NULL
Every blank sits on a row under 30; nobody older lost their income. Age is read
exactly the way if="Age < 30" would read it, so the same rules apply: the column
must be declared above the one that names it.
MNAR — the hole depends on the value that is now gone
Inside missing_when, _value is the value this generator produced for the row —
what the blank would have hidden. It is a name the language provides, like
_count and _last; no config declares it.
<sequence name="Income">
    <gen type="number" value="30000..90000" missing="0.8" missing_as="NULL" missing_when="_value > 60000"/>
</sequence>
income: NULL
income: 53006
income: 52544
income: NULL
income: 52481
income: NULL
income: NULL
income: 35921
Every surviving income is under 60,000. The high earners are the ones who did not answer — which is exactly the bias MNAR names, and exactly what a model trained on the visible rows cannot see.
_value is the value after anomaly= has run, because that
is the value the row would have carried. So missing_when="_value > 150000"
beside an anomaly= blanks the spikes, and the anomaly_flag column agrees: a
blanked cell has no spike left to label.
The small print
- A rate is still required.
missing_whenwithoutmissingdecides nothing, and is refused rather than ignored. - A bare word is a literal, here as everywhere else in the language:
missing_when="Tier == hi"compares against the wordhi. A misspelled column name is reported (TDC215) rather than quietly read as a word. - Not with
repeat=. A repeated cell holds several values on one row and the condition asks about one; rather than guess which reading you meant, the combination is refused. - Both engines. The condition is evaluated per row against the same column reader both engines use, so a streamed run and an in-memory one produce the same file.
Details
- Deterministic. The same
seedproduces the same blanks — see Determinism & proportions. One "holey" dataset reproduces byte for byte, run after run. - Both engines, any volume. Blanks are decided by row number, so memory doesn't grow with the dataset — see Large outputs & streaming.
missing="0"means no blanks at all — exactly as if the attribute weren't there.
See also
- Sequences — the columns you're punching
holes in, and how
${{Name}}reads them. - Text and Number — the generators used in the examples above.
- Masks & case —
order="sequential"and the other cross-cutting generator attributes.