Large outputs & streaming
By default, TDC generates straight to disk. Memory does not grow with the row count: each row is computed on the fly from its number rather than stored in an array, so the practical limit is disk space and time, not RAM. This needs no setup — it is how an ordinary run already behaves. A handful of config shapes are the exception and are listed in Which engine runs your config.
Example outputs on this page are illustrative and can differ by core version. Where the page makes a numeric claim ("exactly 70/30", "128 MB flat"), watch the shape of the result, not the exact bytes.
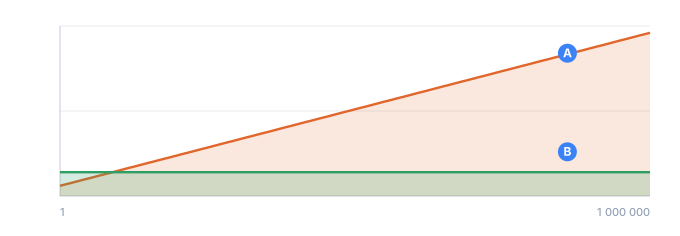
- Aholding every row in memory: the cost grows with the run
- Bstreaming: one window at a time, so the cost stays flat however long the run is
Two disk engines, chosen for you
Two engines run under "disk", and TDC picks between them from your config:
-
The fast streaming engine — used for almost everything. Lazy, multi-threaded (see
--jobs), memory O(number of fields). Exact percentages,parentdependencies,<mix>,<distinct>— all on the fly. -
The exact on-disk engine — for a promise about the finished column rather than the current row: an env-level
<uniq>group,uniq="true"on a compound sequence or on a counter, aparentwhose parent is not a text sequence, and a weightedadvanced_regex—(?%{…}). It guarantees the result exactly, and it pays for that by checking every tuple and repairing the few that repeat. Memory stays bounded while the repeats stay under the repair's cap; past that the run hands itself to the in-memory engine and the memory followscount. See the table below — the cap is the number to reason about, not the row count.Uniqueness is a promise about the finished dataset, not about any one row, so it cannot be settled a row at a time. A worker sees only its own range of rows and could not tell a duplicate outside that range from a value it has never seen — so nobody asks it to. The arrangement is worked out ONCE, before any worker starts, and handed down; the workers only lay out the rows they were given. An env-level
<uniq>group therefore splits across--jobslike anything else, in all five implementations.uniq="true"on a sequence does not, and cannot: it rearranges the generators inside one compound column, which a worker resolving a row on its own has no way to reproduce. That one stays on a single thread and says so.
Disk mode has a third destination, and it is the one worth knowing about: seven config
shapes send the run back to the small in-memory engine, where memory grows with count.
One of them is the commonest way of writing uniq. Which engine runs your
config lists all seven.
The choice is deterministic — based on the config, not the hardware — so the same config gives the same result on every machine (reproducibility across machines is a core TDC guarantee).
Which engine runs your config
mode="disk" asks for bounded memory. It does not always get it. TDC reads the config
first, and seven shapes route the run to the small in-memory engine, whose memory grows
with the row count. They are checked in this order.
| Shape | Why it cannot stream |
|---|---|
A template value that interpolates a field — common.vehicle.model.${{Brand}} | The address is not known until the sibling column has a value, so it has to be resolved per row against the other sequences. |
weight= and row= on the same file generator | Weighting a linked row draw to an exact quota needs the file's totals up front. weight= on its own streams — it is the pair that cannot. |
uniq="true" on a single drawn column, alone or beside literal text | The draw is without replacement, so the pool and the set already taken both span the whole column. |
type="http" — a network call | It is neither reproducible nor synchronous, and resolves in an async pass after the rest of the registry is built. |
A percent= inside a <switch> branch keyed on several values — is="US|CA|MX" — or inside <default> | The share is a quota over the branch's own rows, and those rows are a union of subsets, or what every other branch left behind. Neither can be numbered one row at a time. |
| A column derived from another column — a running total, a statistic, a date measured from another column, a formula | Each reads a column that has to exist first, which the streaming builder refuses by name. |
A bare parent="Name" with no value | It narrows a column to the rows where the parent produced anything, and that is not knowable without the parent's whole column. |
One more shape reaches the same engine without being on this list: a pack body carrying
its own <valid>. Rejecting a drawn row and drawing again is a decision about the whole
column with no row-at-a-time form, so the streaming builder refuses it by name — and a
refusal routes here the way every other refusal does.
Whatever is left that asks about the finished column goes to the exact on-disk engine, and everything else streams.
So uniq lands on two different engines depending on how it is written:
uniq written as | Engine | Memory |
|---|---|---|
uniq="true" on one drawn column — text, number, date, template | in-memory | grows with count |
uniq="true" on a column composed of a drawn part and <data> literals | in-memory | grows with count |
uniq="true" on a counter | exact on-disk | grows with count |
uniq="true" on a compound sequence (named <gen> fields) | exact on-disk | bounded while repeats stay in hand |
An env-level <uniq> group | exact on-disk | bounded while repeats stay in hand |
The last two are bounded, and the bound was proved by FORBIDDING the memory rather than watching it: each run below was given a hard heap ceiling and had to finish inside it.
env-level <uniq> group   4,800,000 rows   finished with the heap capped at 256 MB
compound uniq            4,800,000 rows   finished with the heap capped at 256 MB
env-level <uniq> group  10,000,000 rows   finished with the heap capped at 512 MB
Watching instead of forbidding is what made this table wrong before. Left uncapped, the 4,800,000-row group peaks around 850 MB — but it completes in 256 MB when it is not allowed more, because a garbage-collected runtime takes the room it is given. Peak resident measures what the runtime CHOSE; the ceiling measures what the run NEEDS.
What breaks the bound is repeats, not rows. The repair works on the rows whose tuples
collide, and it holds them; past max(20,000, count / 1000) of them it stops and hands the
run to the in-memory engine, where memory follows count again. Same 4,800,000 rows, two
value spaces:
20,000 x 20,000 values → failed even with the heap capped at 512 MB
40,000 x 40,000 values → finished inside 256 MB
So the number to reason about is how many tuples your values can make against how many rows
you asked for — not the row count on its own. Widen a column and the same run fits. How many
repeats a given config actually produces follows the birthday formula closely — a
6,000,000-row run over 900,000,000 possible pairs handed the verifier 19,851 candidate
groups where the formula predicts about 20,000 — but what that costs does not. Run it and
watch --progress.
The two in-memory rows are the ones that genuinely follow count, and
TDC299 warns about them from 100,000 rows up. A uniq counter
does too: 2,000,000 rows needed 512 MB and 4,000,000 needed 1 GB, measured the same way.
No form of uniq runs on the fast streaming engine. It refuses uniq by name, so a
config that asked for streaming is told rather than handed data that quietly repeats:
tdcv2: stream mode: uniq (a whole-column rearrangement) ("K") is not supported yet — use mode="disk" instead (the router then picks an engine that can), or remove it.You normally never see a message like that. The router picks the engine itself, and a refusal only surfaces when a config names a streaming engine and so has asked to be told.
A downgrade is not a bug. Each of the seven shapes is a promise about a whole column, and an
engine that answered it from one row would emit data that looks right and is not. What it
costs is memory: on the in-memory engine the whole column is held, so a run using one of
these shapes is bounded by RAM rather than by disk. preflight()
estimates that before the run.
The list above is decided before the run, which matters for --jobs: a parallel run
hands each worker a forced streaming engine, and a worker has nowhere to fall back to. A
last-resort net is still there for a rare uniq/distinct/parent edge case the list
cannot see — an automatically routed disk run that the streaming engine refuses anyway
falls back to the in-memory engine rather than failing. A forced --engine 2 still
fails, which is the point of forcing it:
tdcv2: a statistic ("Avg") is computed over every row of the run, including the ones after this one, so it cannot be computed one row at a time; the in-memory engine handles it (run without a forced streaming engine)A forced --engine 3 is the exception, and worth knowing before you measure anything:
it refuses only a uniq too tight for its bounded repair, and on every other shape in the
list above it falls back to the in-memory engine and prints its bytes — exit 0, no message.
Deliberately so, because those shapes are the ones the lazy path cannot express at all and
covering them is what engine 3 is for. It does mean a memory reading taken with
--engine 3 on one of them is a reading of engine 1.
What streams that you might expect not to
Two constructs read the columns beside them and still stream, because each needs only its OWN row — and one row is exactly what the lazy registry can produce:
| Construct | Streams? | Why |
|---|---|---|
<gen type="formula"> | yes | Row i is computed from row i. Nothing before it takes part. |
| A distribution parameter written as an expression | yes | It changes the value the draws become, never how many draws a row spends. |
read="quantile" on a file | yes | The file is sorted once; a row then takes one point on it. |
<gen type="running"> | no | Row 900,000,000 IS the sum of everything before it. |
<gen type="stat"> | no | The rows AFTER this one are part of the answer. |
The dividing line is not "drawn or computed" — it is whether the answer needs a row other than this one.
uniq on a huge output is SLOW — and uniq + percent is the slowest thing TDC doesGuaranteeing that no two rows repeat across a huge file is fundamentally expensive: the exact engine generates, then sorts the whole output and repairs every collision, and that work grows faster than linearly with the row count. Hundreds of thousands of unique rows already run in minutes; millions can run for hours or longer. Memory stays flat — time does not.
The worst case by far is uniq and percent on the same columns. Hitting exact
proportions and no repeats at once is a constrained layout problem stacked on top of the
sort. That is dramatically slower again: a run that would finish quickly with only one of
the two can take an unreasonable amount of time with both. If you can drop either the exactness (let
the proportions be approximate) or the uniqueness, do.
For uniqueness at scale, prefer what's cheap by construction: a
counter, or a number range
wide enough that a collision is vanishingly rare. Reserve uniq="true" — and especially
uniq + percent — for sizes where you can afford the wait. A plain (non-uniq) run of
any size stays fast.
The old mode="disk" is now the default — no flag needed. mode="memory" runs a
small in-RAM engine (exact, but doesn't scale) — the same one behind the object API
(toArray/iterate/getAt). Force a specific engine
with --engine 1|2|3; --stream is a legacy alias of the fast
streaming engine.
A billion rows
<env count="1000000000" seed="s">
  <sequence name="Gender"><gen type="text" value="M,F" percent="70,30"/></sequence>
  <sequence name="Id"><gen type="increment" value="1"/></sequence>
</env>
Here are the first eight rows of that run:
M,1
F,2
M,3
M,4
M,5
F,6
M,7
M,8
count to preview a run that uses percentChange count="1000000000" to count="8" to see it quickly and you get different
rows — M M M M M M F F, not the eight above. percent is an exact quota laid out
over the whole count, so shrinking the run re-lays the whole column; the small run
is not the beginning of the big one. Six M and two F is exactly 70/30 of eight, and that
is the point — the quota is honoured at every size, which is precisely why it cannot also
be a prefix. Same for uniq and a weighted pack; see
the whole-run exceptions.
So a small count is the right way to check the shape — the format, the proportions,
that the fields agree — and the wrong way to predict which value lands on row 5 of the
real run.
TDC uses the fast streaming engine here (no heavy uniq). It does not materialize a registry — each row's value is computed from its number, so memory is O(fields), not O(rows), and the percentages stay exact (precisely 70/30, with no array held anywhere). The result is deterministic.
The fast engine handles almost everything: simple and compound
<sequence>, independent generators
(text, number,
date, regex,
symbol, template), exact
percent, counters, the
built-ins (_count/_first/_last/_total),
parent dependencies (any depth),
<distinct>, and <mix> — all on the fly,
exact, and in parallel. What it does not do is any form of
uniq. Uniqueness is a promise about the finished
column and this engine only ever sees one row, so every uniq goes elsewhere — to the
exact on-disk engine or to the in-memory one, depending on how it is written. Which
engine runs your config says which.
(In the fast engine parent works only when the parent is a sequence with a finite list
of values — a text sequence. Inheriting from a numeric range
sends the config to the exact engine instead.)
Parent dependencies in the stream
A child sequence with parent="Parent.Value" is active
on exactly the rows where the parent produced that value, and its percentages are exact
within the subset. Nesting goes any depth (parent → child → grandchild).
<env count="1000" seed="s">
  <sequence name="Gender"><gen type="text" value="M,F" percent="70,30"/></sequence>
  <sequence name="Male" parent="Gender.M"><gen type="text" value="James,William,Robert" percent="50,30,20"/></sequence>
  <sequence name="Female" parent="Gender.F"><gen type="text" value="Mary,Emma" percent="60,40"/></sequence>
</env>
On M rows the Male field is filled; on F rows the Female field is. First 6 of
1000 rows:
F,,Emma
M,James,
F,,Mary
F,,Mary
M,Robert,
M,James,
The distribution is exact at every level — no arrays, each row computed from its number:
Gender  M         700
Gender  F         300
Male    James     350
Male    William   210
Male    Robert    140
Female  Mary      180
Female  Emma      120
Exactly 700 M and 300 F; inside the 700 males exactly 350/210/140 (50/30/20 of 700),
inside the 300 females exactly 180/120 (60/40 of 300). On "foreign" rows the child field
is blank — Male is empty on female rows, Female on male rows.
Uniqueness across the whole dataset (uniq)
uniq="true" on a compound sequence makes the tuple of all its
fields unique across the whole dataset. That is a promise about the finished column, so
it runs on the exact on-disk engine rather than the streaming one. Each column is laid out
to its exact quota and the tuples are then checked against each other; when one column on
its own already gives every row a different value, the check is skipped.
<env count="6" seed="s">
  <sequence name="Combo" uniq="true">
    <gen name="Letter" type="text" value="A,B,C"/>
    <gen name="Digit" type="text" value="1,2"/>
  </sequence>
</env>
All 6 rows are different — that's the full 3 × 2 space:
C,2
A,1
B,2
A,2
C,1
B,1
The same holds for env-level <uniq>, where the unique tuple is
built from separate sequences rather than from the fields of one:
<env count="6" seed="s">
  <uniq>
    <sequence name="A"><gen type="text" value="x,y,z"/></sequence>
    <sequence name="B"><gen type="text" value="m,n"/></sequence>
  </uniq>
</env>
z,n
x,n
x,m
y,n
y,m
z,m
Memory stays bounded in both shapes: the columns are resolved from the row number, and the duplicate check runs externally rather than holding the dataset. Time is the cost, not RAM — see the warning above.
Capacity is checked before the run starts. If you ask for more unique rows than the data can produce, TDC fails immediately with a clear error — not eight hours later, halfway through the file:
tdcv2: uniq: group "K1 × K2" cannot produce 10000000 unique combinations — the values drawn for these sequences allow at most 100 distinct rows. Add more values to a member (more distinct names, wider ranges…) or lower the count.
The check runs before a single row is built, from the config alone: a list of ten names
can make ten values, an integer range 1..100 can make a hundred, and the product is the
most distinct rows the group could ever hold. A count= in the billions is therefore
answered in milliseconds rather than after the run has reached for memory it will not get.
The one thing it will not do is guess. If any member's capacity is not knowable from its spec — a regex, a pack draw, a file — the group is unbounded here and the answer comes from the check over the built columns instead, exactly as before. A refusal is always a proof.
<mix> in the stream
<mix> picks a case for each row by exact percent (the same
math as percent), then assembles the case body: text, generators, and nested
<mix> to any depth. A generator or nested <mix> inside a case runs on that case's
subset of rows — its counter counts within the case, and nested percentages are exact
within the subset.
<env count="1000" seed="s">
  <mix name="Status" percent="20,50,30">
    <case><data>new</data></case>
    <case><data>active-</data><gen type="number" value="1..3"/></case>
    <case><data>closed</data></case>
  </mix>
</env>
First 6 of 1000 rows:
active-1
new
active-3
closed
active-1
closed
Over 1000 rows the split is exact: 200 new, 500 active-N, 300 closed. <mix> also
composes with parent, in which case it's active only
on the parent's rows.
Why percent + uniq is the expensive pair
Exact percentages are laid out over the whole column; uniqueness is checked over the whole column. Each is affordable on its own. Asking for both at once is a constrained layout problem stacked on top of the check, and that is either full materialization or an NP-hard search. The exact on-disk engine does it anyway, at any size, by holding the layout and repairing the collisions it finds — correctly, and much more slowly than either constraint alone.
Parallelism — automatic
Generation is CPU-bound, not disk-bound (writing is far faster than computing rows), and rows in the streaming engine are independent (each one comes from its own number), so TDC computes them on several cores — which the architecture allows without any extra work on your part.
You set nothing. If the config is splittable (fast engine, no in-line built-in
generators) and the file is big enough, TDC uses cores − 1 (7 on an 8-core box);
otherwise it quietly runs on one core:
npx tdcv2 customers.tdc -o customers.csv
The result is byte-identical regardless of core count (same seed): each core computes a contiguous range of rows into a temp file, and the temp files are then concatenated strictly in order. Thread count is only about speed — it never affects the data.
The automatic count is also cut to fit memory, and this is the usual answer to "why is
this not faster?". Each worker is charged 120 MB plus 50× the on-disk size of every
src= file it will parse, and the total may not exceed half of physical RAM — so a
config reading a large CSV gets far fewer workers than there are cores. The reduction is
announced only when --jobs was passed explicitly; an automatic run makes it in
silence.
A benchmark — 1,000,000 rows, six fields (a counter, two template names, a percent
column, a normal distribution, a date), a 74 MB file, on a 12-core machine:
--jobs | time | speedup |
|---|---|---|
| 1 | 6.93 s | ×1 |
| 2 | 4.04 s | ×1.7 |
| 4 | 2.27 s | ×3.1 |
| 8 | 1.57 s | ×4.4 |
| 12 | 1.72 s | ×4.0 |
| auto | 1.69 s | ×4.1 |
Two lessons. More threads isn't always faster: twelve threads on twelve cores lose to eight — they fight over the same cores and the same disk. And the numbers above belong to that machine, not to TDC.
Where that matters most is a machine whose cores are not all the same. Auto takes
cores − 1, and on an Apple M2 Max — 12 cores, but 8 performance and 4 efficiency — that
reaches into the slow four. The same six-field config, measured here:
--jobs | time |
|---|---|
| 1 | 8.82 s |
| 2 | 6.57 s |
| 4 | 5.00 s |
| 8 | 5.63 s |
| 12 | 6.40 s |
| auto | 6.07 s |
Auto is 21% off the best, and the peak win is ×1.8 rather than ×4.4. On a CPU-heavy column
it can go further wrong: a formula doing sin, log and gauss over 1,000,000 rows took
3.05 s on one thread and 4.71 s on auto — slower in wall time and six times the CPU.
So: leave it alone on a machine with uniform cores, and if a run matters, time it at a few
values of --jobs on the machine that will do it. What never changes is the data — every
one of those runs produced the same bytes.
The speedup depends on how expensive a row is. On a truly cheap config (two fields, a
counter and M,F) the win is only ~×1.6 — spinning up threads costs time, and on light
work that overhead eats most of the gain. A speedup figure quoted without its config is
meaningless.
Set it by hand with --jobs N if you want (--jobs 1 forces
single-threaded); the output is identical either way:
npx tdcv2 customers.tdc --jobs 8 -o customers.csv
Sometimes parallelism does not kick in, and the rule is narrower than it looks. Both
row-at-a-time engines split a run across cores — the fast streaming one and the exact
on-disk one — so a config that only fell back from engine 2 to engine 3 still uses every
core. What cannot be split is a run on the in-memory engine, and one shape in
particular: uniq="true" on a sequence, which rearranges the generators inside a compound
column, and a worker resolving a row on its own cannot reproduce that.
An <uniq> GROUP at the <env> level is not that shape and does parallelise. Measured on
1,500,000 rows: --jobs 1 spent 17.4 s of CPU, --jobs 8 spent 52.0 s across eight
workers, and the two files are byte-identical, exactly as --jobs promises.
Auto stays quiet when it cannot split, but if you asked for --jobs explicitly, TDC tells
you why. The output is correct either way.
Nor does it below 100,000 rows. Under that, spawning the threads and joining the pieces costs more than the split saves, so auto stays on one. The number is worth knowing for one reason: it is the only thing that changes between a run of 99,999 rows and one of 100,000, so if those two ever differ in anything but length, the split is where to look.
The engine is chosen from your config, not your hardware
Which of the three engines runs is decided by TDC from the config's contents, never from the machine. This matters: if the choice depended on "how much RAM is free right now", then the same config with the same seed could produce different data on different computers — and cross-machine reproducibility is TDC's central guarantee. Because routing depends only on the config, a given config always takes the same engine and gives the same result everywhere.
The memory estimate (preflight(), below) is only advice; it switches nothing and
changes no output. To force a specific engine use
--engine 1|2|3 (advanced); mode="memory" is the small in-RAM
engine for small datasets.
The same override exists inside the config, as engine on <env> — the flag
without the command line:
<env count="1000" seed="s" engine="1">
1 is in-memory, 2 streaming, 3 exact-on-disk; anything else is an error. Prefer
mode="memory" / mode="disk", which say what you want rather than which
implementation delivers it — engine numbers are an escape hatch for reproducing a
specific behavior, and a config pinned to an engine won't benefit from better routing
later. When both are present, engine wins over mode; a --engine or --mode on the
command line overrides either.
Terminal methods (the library)
Every method here goes through whichever engine the router picks — the object ones included. None of them forces the in-memory engine, so none of them materialises a registry: memory is O(fields) unless the method's own return value is the thing that grows.
| Method | Text output | Memory | Use for |
|---|---|---|---|
toString() | collected whole | O(fields) + the full text | small / medium results |
toIterator() | one row at a time | O(fields) | large text results, row by row |
toStream() | Node Readable | O(fields) | pipe to a file / HTTP / archiver |
writeFile() | chunks to a file | O(fields) | simplest way to write a big file |
| CLI | chunks | O(fields) | the command line |
toArray() | object rows, whole | O(rows) — it returns them | small / medium object fixtures |
iterate() | object rows, one-by-one | O(fields) | object output, one row at a time |
getAt(index) | one object row | O(fields) | point access, not bulk |
toArray() is the only object method whose memory grows with count, and it grows because
the array it hands back IS every row. iterate() and getAt() build nothing of the sort.
Measured on a 50,000,000-row config: getAt(49_999_999) answered in 4 ms and the first
three rows of iterate() arrived in 2 ms, both on a flat heap.
For big files, use the CLI, writeFile(), toIterator(), toStream() — or iterate()
if you want objects rather than text:
const tdc = new TDC({ configFile: "./customers.tdc" });
tdc.writeFile("./customers.csv");
Or through a stream:
import { createWriteStream } from "node:fs";

tdc.toStream().pipe(createWriteStream("./customers.csv"));
Proof: half a million rows, memory stays flat
Claims about "O(fields)" are worth more with real numbers behind them. Take a 500,000-row config and run the terminal methods.
writeFile() — a file on disk. It writes chunks as it generates:
bytes: 4388895        // ~4.4 MB, 500,000 rows
M,1
M,2
M,3
toIterator() — walk every row, memory doesn't move. Sampling process RSS at
checkpoints as the row count grows:
rows=100000  RSS=128 MB
rows=200000  RSS=128 MB
rows=300000  RSS=128 MB
rows=400000  RSS=128 MB
rows=500000  RSS=128 MB
The line is flat — 128 MB at 100,000 rows and the same 128 MB at 500,000. Watch the flatness, not the absolute number: RSS depends on the machine and the Node version, and this was an Apple M2 Max on Node 20.
toStream() equals writeFile() byte-for-byte. Both take the same streaming path:
new TDC({ configFile: "./customers.tdc" })
  .toStream()
  .pipe(createWriteStream("out2.csv"));
// md5(out2.csv) === md5(out.csv)  →  true
preflight() — a memory-risk estimate
preflight() estimates memory risk before generating, comparing the estimate to the
machine's total RAM (not "free right now" — the OS hands memory to a process on
demand, so a snapshot of what's free at this instant is misleading).
const diagnostic = tdc.preflight();
On a normal (disk) run even half a million rows is no risk at all — preflight() returns
undefined. It only warns for an explicit mode="memory" on a large count, where the
data really is materialized:
// disk (default), 500,000 rows:
new TDC({ configFile: "./customers.tdc" }).preflight();
//  →  undefined

// mode="memory", 50,000,000 rows — returns a Diagnostic:
const d = new TDC({
  configFile: "./customers.tdc",
  mode: "memory",
  count: 50_000_000,
}).preflight();
d.severity  warning
d.code      TDC200
d.message   estimated memory need (~20.5 GB) is a large share of this
          machine's RAM (32.0 GB) — may lean on swap and slow down
d.hint      This will still run; for very large datasets mode="disk"
          keeps memory flat regardless of count.
So on an ordinary disk run preflight practically never fires: the streaming engine holds O(fields), not O(rows), so a billion rows go through without a complaint — that's what it's built for. The estimate is only advice; it doesn't switch engines or change output.
If you know you'll consume streaming output through toString(), name the scenario
explicitly:
const diagnostic = tdc.preflight({ output: "streaming" });
What gets materialized in RAM
Both disk engines keep nothing extra in memory. Materialization happens in the small
in-RAM engine — reached by the object API (toArray/iterate/getAt), by an explicit
mode="memory", and by any of the six config shapes that route a disk run back to
it. There it holds, up front:
- the built-ins
_count,_first,_last,_total; - each simple
<sequence>; - each field of a compound sequence;
- parent-filtered arrays of values or
undefined; - CSV row-link plans for linked external data.
A rough estimate: count × number_of_sequence_slots. For example, this compound sequence:
<sequence name="Person">
  <gen name="FirstName" type="template" value="person.female.firstName"/>
  <gen name="LastName" type="template" value="person.lastName"/>
</sequence>
Emma Johnson
Olivia Smith
Sophia Brown
Ava Davis
Mia Wilson
takes two sequence slots: Person.FirstName and Person.LastName.
Practical rules
- For a file of any size, just use
writeFile()or the CLI — it's disk by default, and memory doesn't grow with rows. - Before a very large run, check the config against the six shapes that route it back
into memory. Simple
uniq="true"is the one to watch. - To speed up a big run, add
--jobs N(on the fast engine). toString()suits tests and small results, but collects all text into one string — not for big files.toArray()returns every row as an object, so its memory is the array itself — that one is for small sets.iterate()andgetAt()are not: they run on the same engine as text output and hold nothing, soiterate()is a fine way to stream objects.
See also
- CLI —
--jobs,--mode,--engine. - Unique values —
uniq,<uniq>,<distinct>in depth. - Hierarchical dependencies —
parentin depth. - Language Bindings — the library API in full.