Anomalies & outliers — anomaly
Use it when you're building test data for an anomaly detector, a monitoring
alert, or an outlier-robust model — anything that has to notice values sitting far
outside the normal range. Real data always has a few: a stuck sensor, a fat-finger
entry, a suspicious transaction. The anomaly attribute injects those spikes on
purpose, at a rate you choose, so your pipeline has something abnormal to react to.
There are two routes, and this page covers both:
| Route | Outlier looks like | Ground-truth column |
|---|---|---|
anomaly="p" on a <gen> producing numbers | the base value × a factor | anomaly_flag="Name" |
anomaly="true" on a <case> inside a <mix> | whatever that branch generates | flag="Name" |
Reach for the first when a "too big" number is outlier enough. Reach for the second when the outlier needs its own shape — a different range, a garbage string, a rare but legal event.
The numbers below are what a typical run produces. Exact draws can differ by core
version and seed — what stays fixed is the structure: which rows spike is
decided by the row number, so the ground-truth column always agrees with the value.
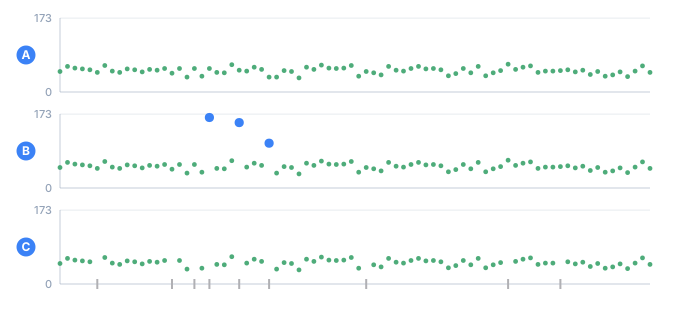
- Athe clean series
- Bwith anomaly= — the marked points are the injected outliers
- Cwith missing= — the marks on the floor are rows that produced no value
How to enable
Put anomaly="p" on a generator that produces numbers, where p is the fraction of
values (0 to 1) that become outliers. The size of each spike is anomaly_factor
(default 10):
<gen type="number" distribution="normal" mean="50" sd="3" anomaly="0.15" anomaly_factor="8"/>
About 15% of the values get multiplied by 8 — normal readings sit near 50, the
outliers land near 400. An outlier is exactly the base value multiplied by the
factor. It works on numbers only; non-numeric values in a mixed list pass through
untouched, and a list with no numbers at all is refused outright (TDC243) rather than
decorated with an attribute that could never fire (see
Details).
A spike keeps the shape of the value it replaced: the same number of decimal places,
and the same width where length= padded it with zeros. An
outlier is far from the others in value, not in format — a column of five-digit
identifiers stays five digits wide, and a column declared with decimals="2" keeps two
places, so it still loads as the type it was declared. The padding only ever adds, so a
spike that genuinely outgrew the width keeps its extra digits.
Before and after — the same series, with and without spikes
Problem. Show only the dirty column and you can't tell a spike from a genuinely
large value — is 460 a fault or just a big reading? You need a clean reference
right next to it.
Tool. Take one list of readings with order="sequential"
(strictly in order) and build two columns from it: Clean as-is, and Dirty —
the same series with anomaly. Row by row the base value matches, so every spike is
obvious: it's the same number, times the factor.
<env count="12" seed="demo">
  <sequence name="Clean"><gen type="text" value="48,50,46,52,49,51,47,53,50,48,52,49" order="sequential"/></sequence>
  <sequence name="Dirty"><gen type="text" value="48,50,46,52,49,51,47,53,50,48,52,49" order="sequential" anomaly="0.3" anomaly_factor="10"/></sequence>
</env>
...
<data>clean=${{Clean}} | dirty=${{Dirty}}</data>
clean=48 | dirty=48
clean=50 | dirty=50
clean=46 | dirty=460
clean=52 | dirty=52
clean=49 | dirty=49
clean=51 | dirty=510
clean=47 | dirty=47
clean=53 | dirty=53
clean=50 | dirty=50
clean=48 | dirty=480
clean=52 | dirty=52
clean=49 | dirty=49
Three rows spiked: 46 → 460, 51 → 510, 48 → 480 — exactly ×10. No "← outlier"
annotations needed: the reference is on the left, the spike is on the right, and the
difference speaks for itself. On 12 rows at anomaly="0.3" this run produced 3
spikes (the rate is random, and on a small sample the spread is wide).
Why/when. This side-by-side is the fastest way to sanity-check that anomaly is
doing what you think before you scale up to a real dataset.
How big the spike is — anomaly_factor
Problem. A "soft" outlier (a little above normal) and a "hard" one (many times over) are caught by different thresholds. You need control over the spike height.
Tool. Change only anomaly_factor; keep everything else the same — same
sequence, same seed, same anomaly="0.25". With the seed, the name, and the rate
fixed, the same rows spike every time — only their height changes.
<gen type="text" value="48,50,46,52,49,51,47,53,50,48,52,49"
     order="sequential" anomaly="0.25" anomaly_factor="5"/>   <!-- then 10, then 20 -->
anomaly_factor="5" → "10" → "20", same 12 rows in each:
factor=5    factor=10    factor=20
240         480          960
50          50           50
230         460          920
52          52           52
49          49           49
51          51           51
235         470          940
265         530          1060
50          50           50
48          48           48
52          52           52
245         490          980
The base on row 8 is 53: 53×5=265, 53×10=530, 53×20=1060. The outlier rows
(1, 3, 7, 8, 12) are identical across all three columns — anomaly_factor controls
only the height, never which rows spike. (Which rows spike depends on the
seed and the sequence name — rename the sequence and the spikes move.)
Why/when. Sweep the factor to find where your detector's threshold starts and stops firing, without changing anything else.
How many spikes — the anomaly rate
Problem. A rare fault (one in a hundred) and constant noise need different
thresholds. The anomaly value itself sets how often a spike happens.
Tool. Pin the base value at 50 so a spike (500) is visible at a glance. Left
column anomaly="0.1", right column anomaly="0.5", 20 rows:
<env count="20" seed="demo">
  <sequence name="Low"> <gen type="number" value="50" anomaly="0.1" anomaly_factor="10"/></sequence>
  <sequence name="High"><gen type="number" value="50" anomaly="0.5" anomaly_factor="10"/></sequence>
</env>
...
<data>rate 0.1: ${{Low}}   rate 0.5: ${{High}}</data>
value="50" on a number is a constant — the whole column is 50 until an anomaly
lifts a row to 500. Reach for number rather than a one-item text list whenever a
column holds numbers: a text list is checked by reading it, so a mixed list like
value="hello,50" accepts anomaly= and then spikes only where a number happens to
land, delivering less than the rate it was given. In number every value is a number
by construction, so the rate asked for is the rate delivered.
rate 0.1: 500   rate 0.5:  50
rate 0.1:  50   rate 0.5: 500
rate 0.1:  50   rate 0.5: 500
rate 0.1:  50   rate 0.5: 500
rate 0.1:  50   rate 0.5: 500
rate 0.1:  50   rate 0.5:  50
rate 0.1:  50   rate 0.5:  50
rate 0.1:  50   rate 0.5:  50
rate 0.1:  50   rate 0.5:  50
rate 0.1:  50   rate 0.5:  50
rate 0.1: 500   rate 0.5: 500
rate 0.1:  50   rate 0.5: 500
rate 0.1:  50   rate 0.5:  50
rate 0.1: 500   rate 0.5: 500
rate 0.1: 500   rate 0.5:  50
rate 0.1:  50   rate 0.5:  50
rate 0.1:  50   rate 0.5:  50
rate 0.1: 500   rate 0.5: 500
rate 0.1:  50   rate 0.5:  50
rate 0.1:  50   rate 0.5: 500
The left column spiked 5 times out of 20, the right one 9 — a higher rate means denser outliers.
Twenty rows is a small sample, and it shows: 5 and 9 against the 0.1 and 0.5 that were asked for. The rate is a probability per row, not a quota, so a short run wobbles around it and a long one settles on it — the same config over 4,000 rows measures 10.2% and 50.1%. Expect your own twenty rows to look different from these; that is the rate working, not failing.
anomaly combines with anything: a range, a
distribution, or missing.
Why/when. Match the rate to the phenomenon you're modeling — a rare defect at
0.01, a badly flaky sensor at 0.4.
The ground-truth column — anomaly_flag
Problem. The outliers are injected — but to grade a detector you need the right answer: exactly which rows are anomalous. From the numbers alone, a faulty spike is indistinguishable from a legitimately large reading.
Tool. Add anomaly_flag="Name" next to anomaly and TDC creates a new
column — a sequence called Name holding true/false, true on precisely the
rows that spiked:
<gen type="number" distribution="normal" mean="50" sd="3"
     anomaly="0.2" anomaly_factor="8" anomaly_flag="IsOutlier"/>
...
<data>${{Reading}},${{IsOutlier}}</data>
360,true
48,false
49,false
51,false
52,false
52,false
47,false
49,false
360 (≈ 45 × 8) is marked true; the ordinary readings are false. The flag is
computed from the same decision as the spike itself, so the two can never
disagree — and this holds in every engine, at any volume.
That promise is what decides the one case where they could: a cell
missing blanked has no spike left to describe, so its
flag is false. A label saying "outlier" beside an empty cell would teach a detector
something untrue on every such row, and blanking is not something the anomaly draw knows
about.
The flag is an ordinary column, so you can filter on it with
if. Keep only the outliers with
if="IsOutlier" (it reads the row's truthiness, like the _first/_last
built-ins):
<block><line if="IsOutlier"><data>outlier: ${{Reading}}</data></line></block>
outlier: 360
outlier: 392
outlier: 400
Out of 20 readings, 3 came through as anomalies — a ready-made labeled dataset for scoring a detector's precision and recall.
Why/when. Any time you need to measure a detector, not just feed it.
anomaly_flag without anomaly is an error, because there is nothing to mark.
The flag needs a sequence whose value is that one <gen>. Give the body a second
part — another <gen>, a <data> literal, or a name= that turns the gen into a
field — and there is no row-level column to put the flag in, so the config is
refused (TDC283) rather than run without it. Move the
gen into a <sequence> of its own; that also gives you the value as its own column.
A custom outlier — flag on a <mix>
Problem. anomaly="p" can only multiply. Sometimes the outlier has to look
different — its own range, its own text, a rare-but-legal event — and you still want
a ground-truth column that says which rows are the odd ones.
Tool. Describe the outlier as its own branch of a <mix>,
tag that <case> with anomaly="true", and ask the mix for
a ground-truth column with flag="Name". Here
temperatures are usually 20–24, but a quarter of the time a stuck sensor reads
90–99:
<env count="12" seed="sensor-2026">
  <sequence name="Id"><gen type="increment" value="1"/></sequence>
  <mix name="Temp" percent="75,25" flag="Bad">
    <case><gen type="number" value="20..24"/></case>
    <case anomaly="true"><gen type="number" value="90..99"/></case>
  </mix>
</env>
<block>
  <line><data>${{Id}},${{Temp}},${{Bad}}</data></line>
</block>
Columns are id, temp, bad:
1,23,false
2,21,false
3,22,false
4,21,false
5,24,false
6,23,false
7,21,false
8,92,true
9,20,false
10,97,true
11,21,false
12,98,true
Three of twelve rows — exactly 25%, just as percent asked
for — and bad is true on every one of them. The label comes from the same
choice that picked the branch, so it can't drift away from the value.
Why/when. anomaly="true" on a <case> is only a label — it injects
nothing and changes nothing; the outlier is produced entirely by the branch's own
generator (<gen type="number" value="90..99"/>). That means you control exactly
what the outlier looks like — unlike anomaly="p", which can only scale a number.
The two halves only work together
TDC checks that the label and the column are both present:
| What you wrote | What TDC says |
|---|---|
anomaly="true", but the <mix> has no flag= | error TDC203 — the label has nowhere to go |
flag=, but no <case> is marked | error TDC202 — the column would be all false |
flag= on a nested <mix> | error TDC203 — only a named mix owns the column |
In Parquet — a real type
When you export to Parquet, the ground-truth column becomes a genuine BOOLEAN and
the values keep their numeric type, with no type= anywhere. A typed file needs its
columns named, so the <block> says so — one <data name="…"> per column instead of
one line of commas:
<block>
  <line>
    <data name="id">${{Id}}</data>
    <data name="temp">${{Temp}}</data>
    <data name="bad">${{Bad}}</data>
  </line>
</block>
The container is chosen by the output's extension — there is no --format flag:
id     INT64    REQUIRED
temp   INT64    REQUIRED
bad    BOOLEAN  REQUIRED
The value type is inferred only when all branches agree (both are numbers here). If one branch returns a number and another returns a word, the column stays text — TDC never guesses a type it isn't sure of. See Output formats.
More ways to use it
- Grading a data cleaner. Tag a branch that emits junk — a malformed address, an empty phone — and see how many flagged rows the cleaner actually removes.
- Several kinds of defect. You can tag more than one branch;
flagistrueon every marked case. - Marking a "rare event." The tag doesn't have to mean broken — it can mark a rare but perfectly legal case your model should still learn to catch.
Details
- Deterministic. The same
seedgives the same outliers, on the same rows. See Determinism & proportions. - Any engine, any volume. Outliers are decided by row number, so in-memory and on-disk runs agree exactly.
- Numbers only, and it's the value that decides — not the
type=. In the examples above the list is written astype="text", but the values are numbers, soanomalymultiplies them. Put it on a column of names and the values pass through unchanged.checknames that when the whole list is written in the config (TDC243) — it can read every candidate there. When the values come from a pack, a file or a regex it cannot, soanomaly=on a column of names from those passes through silently. If a column that should have spikes comes out clean, this is the first thing to check. anomaly="0"means no outliers.
See also
- Number generator — ranges and distributions to
attach
anomalyto. - Generators overview —
missing=andanomaly=side by side, both applied after the value is produced. - Tags reference —
<mix>and<case>, the branching the custom-outlier route builds on. - Output & formatting — the
ifexpression that filters on a ground-truth column.